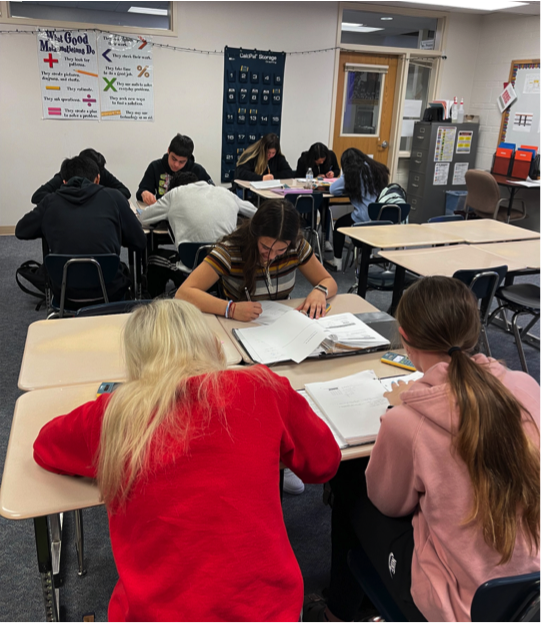
Fourth quarter here we go! In Algebra 1A, my students are continuing to learn about statistical models and using data sets to find different values. Also, they are using that data to create statistical representations like histograms and box plots. In Algebra 1, we’re completing our module where we graphed quadratic functions and transformed equations into different quadratic forms.
Lexington Public Schools
300 South Washington St
P.O. Box 890
Lexington, NE 68850
Copyright © Lexington Public Schools. All rights reserved.
Lexington Public Schools does not discriminate on the basis of race, color, national origin, sex, marital status, disability, or age or in admission or access to, or treatment of employment or educational programs and activities.
Complaints involving discrimination or harassment on the basis of race, color, national origin, gender, marital status, disability, or age may also be submitted, at any time to the School District’s Title IX/504 coordinator. The following person has been designated to handle inquiries regarding the School District’s non-discrimination policies: Angie Kovarik, who may be contacted in writing at 300 South Washington Street, Lexington, NE 68850; by email: angie.kovarik@www.lexschools.org; or by telephone at (308) 324-1209. More information can be found at www.lexschools.org/title-ix/
Any person may also contact the Office for Civil Rights, U.S. Department of Education, by email at OCR.KansasCity@ed.gov; by telephone at (816) 268-0550; or by fax at (816) 268-0599, regarding compliance with the regulations implementing Title VI, Title IX, Section 504, or any other applicable laws.
Website design and development by Firespring